College Board to Add ‘Adversity Score’ to SAT in Hopes of Promoting Diversity
May 16, 2019

Sky Motion / Shutterstock
A story in the Wall Street Journal today brought national attention to a program by the College Board that assigns what the newspaper calls an “adversity score” to students who take the SAT.
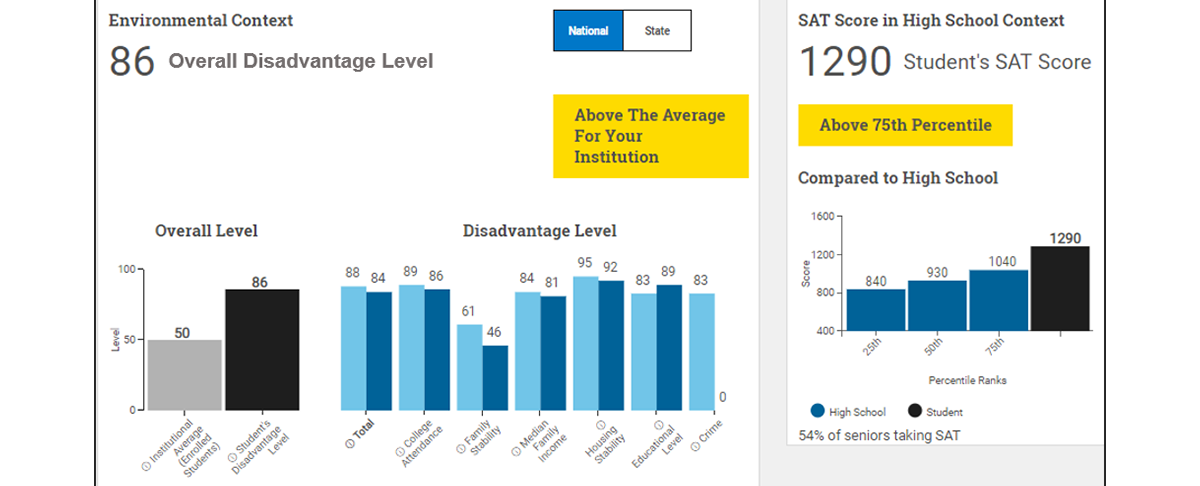
The score is a number from 1 to 100, where 50 is average. Anything above 50 indicates a student came from a background of hardship, and anything less means relative advantage. In an example screenshot provided by the College Board, a sample student was shown with an “overall disadvantage level” of 86. The goal is to help colleges weigh the cultural and socioeconomic background of students as they review their applications.
The report brought a wave of national interest in the project—along with questions about how any group can accurately put a number on something like adversity.
College Board officials said Thursday that they have been talking openly about the project for more than a year, though they have never used the term “adversity score.” The group said the metric is part of what it calls an Environmental Context Dashboard, which it has been piloting in 50 colleges this year and hopes to roll out as a free service nationwide. The numbers are provided only to admissions officials, and not visible to test takers.
Officials stressed that race is not used as a factor in computing the score. The issue of whether colleges are legally allowed to use race in admissions has been hotly contested in the courts, including in an ongoing federal lawsuit by Asian-American students against Harvard University that is expected to be decided soon.
Jeremy Singer, president of the College Board, mentioned the Environmental Context Dashboard when he sat down with EdSurge in April for an interview on our weekly podcast. “The goal of this is to be used by admissions officers at higher-ed institutions to evaluate the context from which a student is coming from—so the community, the school, et cetera,” Singer said. “An SAT score of 1400 in East L.A. is not the same as a 1400 in Greenwich, Connecticut. And so, if we can get environmental factors that the student could have overcome or thrived on, and take into context,” that will help them.
“It’s gotten results,” he added. “Florida State University was able to increase their underrepresented class this year using the tool, from 37 percent to 42 percent. That may not sound big, but a 5 percent growth in the students that they’re targeting by using this tool is significant.”
Singer told EdSurge in the April interview that college admissions officers have long sought out contextual information about students. “To be clear, higher-ed institutions have been trying to do this for a long time, but they don’t always have the right tools to do it,” he said. “They don’t view every school as the same, but this is a much more effective way to [show differences using data] than they’ve had in the past.”
Where The Score Comes From
In a statement today, the College Board said that the dashboard data is drawn from sources like the U.S. Census and includes “contextual information on students attending a particular high school including SAT performance, AP performance, average number of AP courses taken, percentage of students eligible for free and reduced-price lunch, etc. and neighborhood information including average family income, familial structure and stability, educational attainment, housing stability, and crime.”
"We’re not going to use this solely. It is one of many inputs that we would use to arrive at a decision.”—Eric Maloof, vice president for enrollment management at Trinity University.Trinity University, in Texas, is among the institutions that has been piloting the dashboard.
“It’s really important to understand that the data in the dashboard does not necessarily represent the student’s personal experience,” said Eric Maloof, vice president for enrollment management at Trinity. “Rather, it suggests the environment to which they were likely exposed.”
He said that he was eager to try the tool in the university’s admissions process because Trinity has become more selective in recent years, and officials want to continue to admit a diverse population of students. “Increasing selectivity usually works against diversity,” he said, “and we didn’t want that to happen at Trinity.”
Maloof argued that the new tool makes its process more efficient, but doesn’t represent a revolution in how it reviews applicants. “The more inputs for our admissions staff that I can gather for them, the better,” he said. “We’re not going to use this solely. It is one of many inputs that we would use to arrive at a decision.”
In other words, looking at a student’s SAT score alongside the information in the dashboard can help college officials decide “who is really outperforming their environment,” he said.
The fairness of the college admissions process has come under increased scrutiny in recent months, after federal prosecutors charged nearly 50 people with crimes in connection to an admissions-fraud scheme. Parents participating in the scheme paid between $15,000 and $75,000 per test to have someone take the SAT and ACT exams in place of their child, or to correct exam questions just after the test to boost their scores. In at least one case, the student was unaware that their parent had paid to improve their score.
Jeffrey R. Young (@jryoung) is a senior editor at EdSurge covering higher education and the co-host of the EdSurge podcast. He can be reached at jeff [at] edsurge [dot] com.
Popular on Edsurge
Opinion