How Data Science Adds Computational Thinking—and Fun—to Gym Class
By Eli Sheldon
July 25, 2018

By Kluva/Shutterstock
It’s the bottom of the ninth with two outs and it’s all tied up. You’ve got a runner on first base and you need to decide who you’re sending to the plate. You have a player with a stellar batting average, a player reliable for drawing walks and one who promises they can win it all for you—who do you play?
In the fall of 2002, the Oakland Athletics shattered a 55-year-old record with twenty consecutive games won. The A’s accomplished this on a shoestring budget and despite losing three of their best players at the start of the season. How, you ask? By applying rich data analysis to the sport, a practice known as sabermetrics. When we set out to design an engaging kickball unit for our middle school students, we asked ourselves how we could learn from the 2002 A’s.
In short, we wondered how we could combine data analysis, computational thinking and kickball to make the P.E. experience more personal, more academically rigorous and more inclusive to students of all athletic abilities.
Data Goes to the Gym
As a self-confessed nerd, my memories of middle school kickball are of being picked last and worrying about taking errant kicks to the face. In my role as computational thinking curriculum specialist, and in collaboration with P.E. teacher Eric Murphy, I took it as a personal mission to do better with the middle schoolers at Excel Public Charter School in Kent, Wash. We serve a wonderful, diverse group of students with varying athletic abilities and social standings, and we wanted to ensure each and every one of them saw themselves as both an athlete and a productive member of a team.
Seth is a perfect example. An 8th grader excelling in his core academic classes, Seth was often overlooked in P.E. class based on his small size and academic prowess. In fact, his only grade below an A in first semester was in P.E., as he often struggled to see himself as a successful athlete. Seth needed a way to demonstrate his mastery of the learning objectives, and a way to help his peers overcome their prejudices and understand his value to the team.
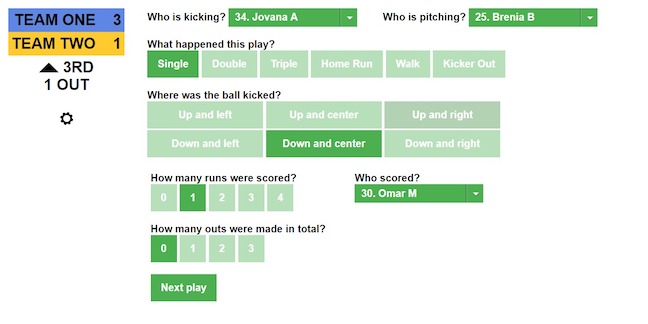
Sabermetrics was our answer, much as it was for the struggling Oakland A’s. We named our unit MoneyKickball after “Moneyball,” the book-turned-movie written about that crazy season. During MoneyKickball games, a rotating Data Captain from each team was responsible for capturing play data in real-time. Data was captured using a simple web form I coded myself, pictured below. For each play, the Data Captain would record the kicker and pitcher, the outcome of the play, the direction the ball was kicked, any runs scored and any outs incurred.
This data was then aggregated across games to create individual athlete profiles, which students eagerly checked after each game. As with core academic classes, we placed an intentional focus on personal growth and goal-setting over students recording the “best” stats. If a student elected to increase their On-Base Percentage or OBP—calculated from the number of times they got on base—then it didn’t matter if they were five hundred points below their peers’ average. If they were improving week to week, they were both personally triumphant and contributing to the success of their team.
Playing Your Best
However, game data was collected for much more than just goal tracking. One of the core computational thinking skills our students practice across all courses is pattern recognition, which we define as analyzing trends in data to inform solutions. At the start of every class, a new set of Data Captains were tasked with drafting fresh teams using fully anonymized player data. Gone were the days of teaming up with your friends or counting off “one two, one two;” with data this rich, we couldn’t afford not to leverage it at every possible opportunity. In fact, Seth was consistently among the first students picked—with stellar and improving stats from previous games, he was always a highly coveted player that would likely have been overlooked without the data having been anonymized.
With data this rich, we couldn’t afford not to leverage it at every possible opportunity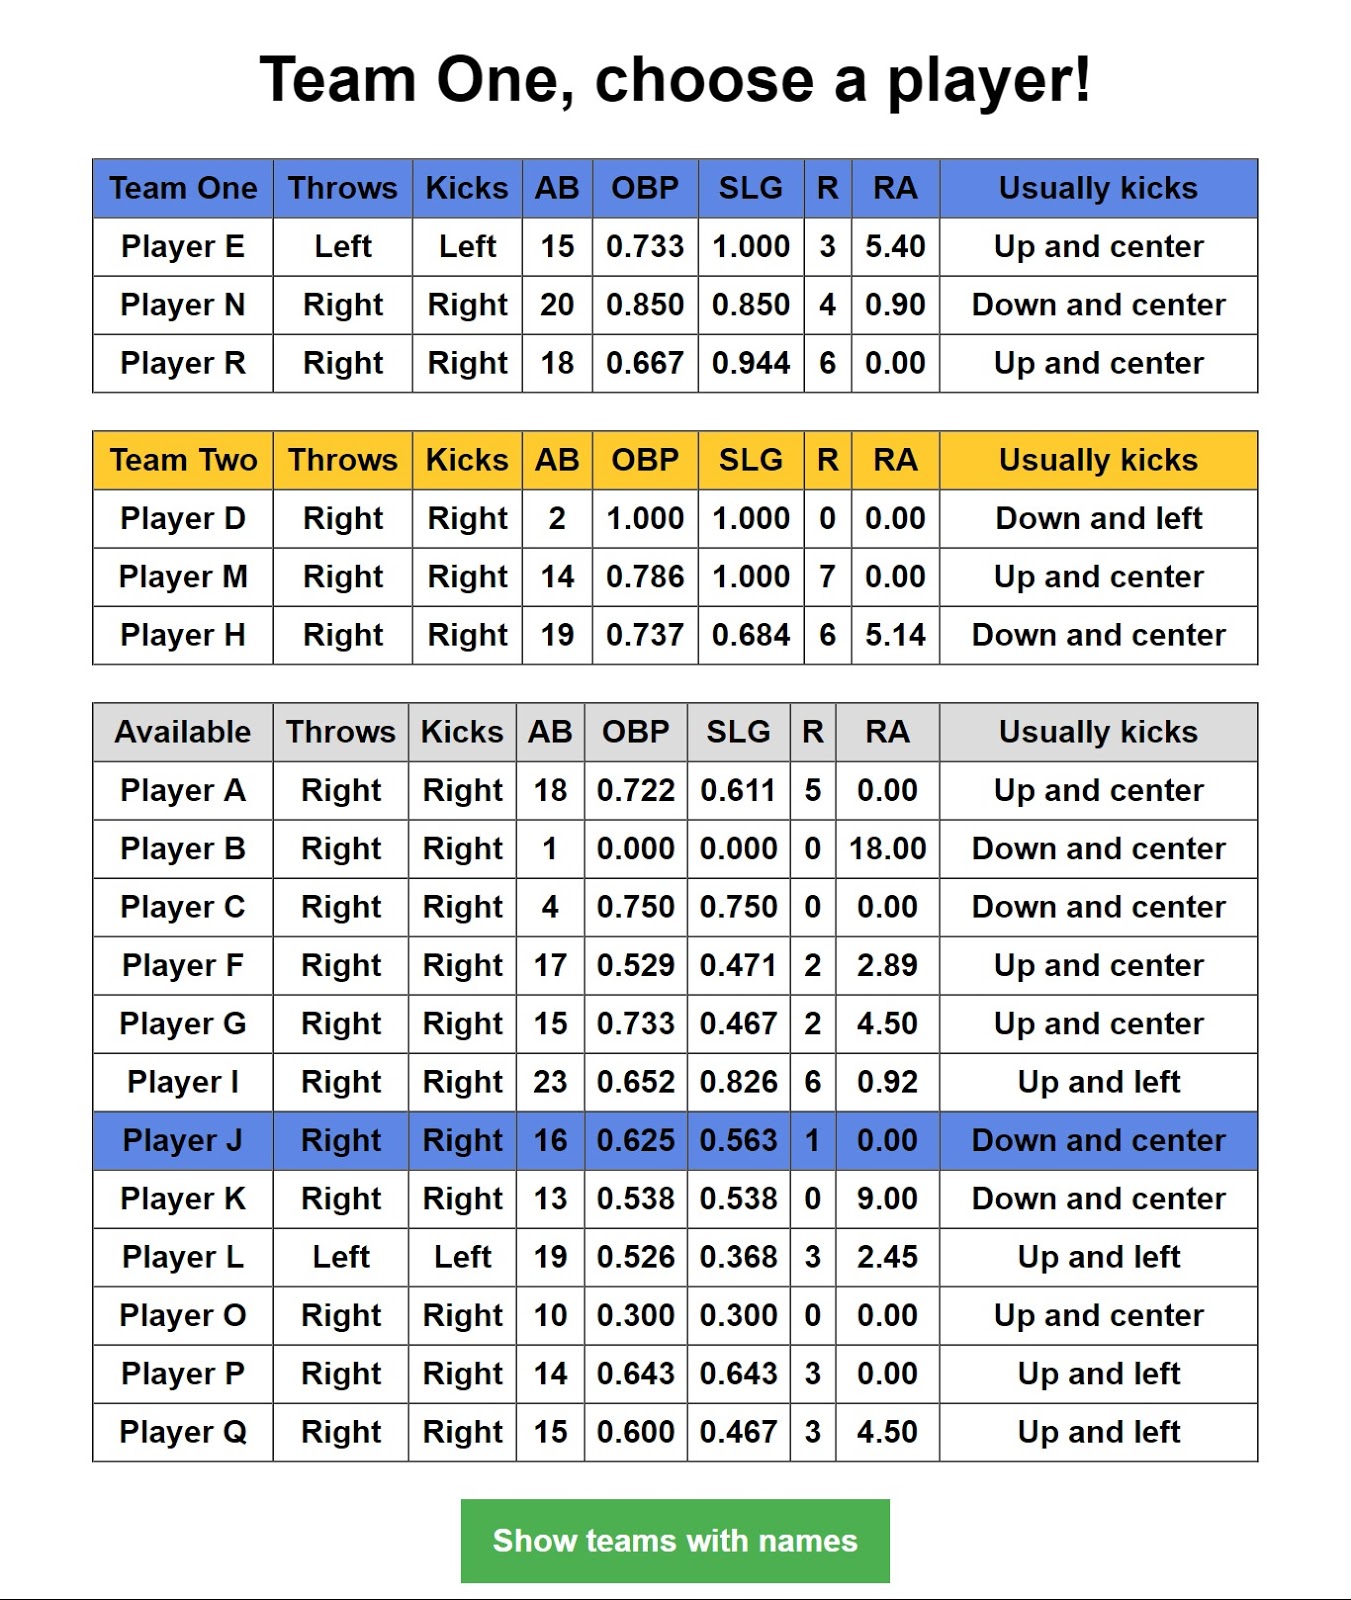
Selecting players isn’t an easy task—there are numerous stats to balance, and each student served as a Data Captain at least once to ensure they developed the required skills. Would having a mix of left-footed and right-footed kickers be beneficial? Was a player with a high OBP more valuable than a player with a high Slugging (SLG) percentage? What about a reliable mix of airball-kickers and grounder-kickers? Without an obvious right answer, ever-changing team dynamics allowed students to form their own ideas throughout the unit.
NEWSLETTERS
STAY AHEAD IN EDUCATION.
Sign up for EdSurge newsletters for timely news, insights and analysis.
Player data was used during gameplay as well. After drafting their teams, those same Data Captains used offensive stats to set the order of their lineups and to select their pitchers. When a new kicker on the opposing team came to the plate, the Data Captain could shift the infield or outfield based on data showing where the kicker typically sent the ball. Instead of relying on guesses or unreliable memories, each decision was driven by the data. In this way, all students were empowered to help their team succeed, independent of their athletic ability. As Data Captain, Seth in particular excelled at knowing when to change pitchers and how to use the data to optimize the placement of his fielders.
Instead of relying on guesses or unreliable memories, each decision was driven by the data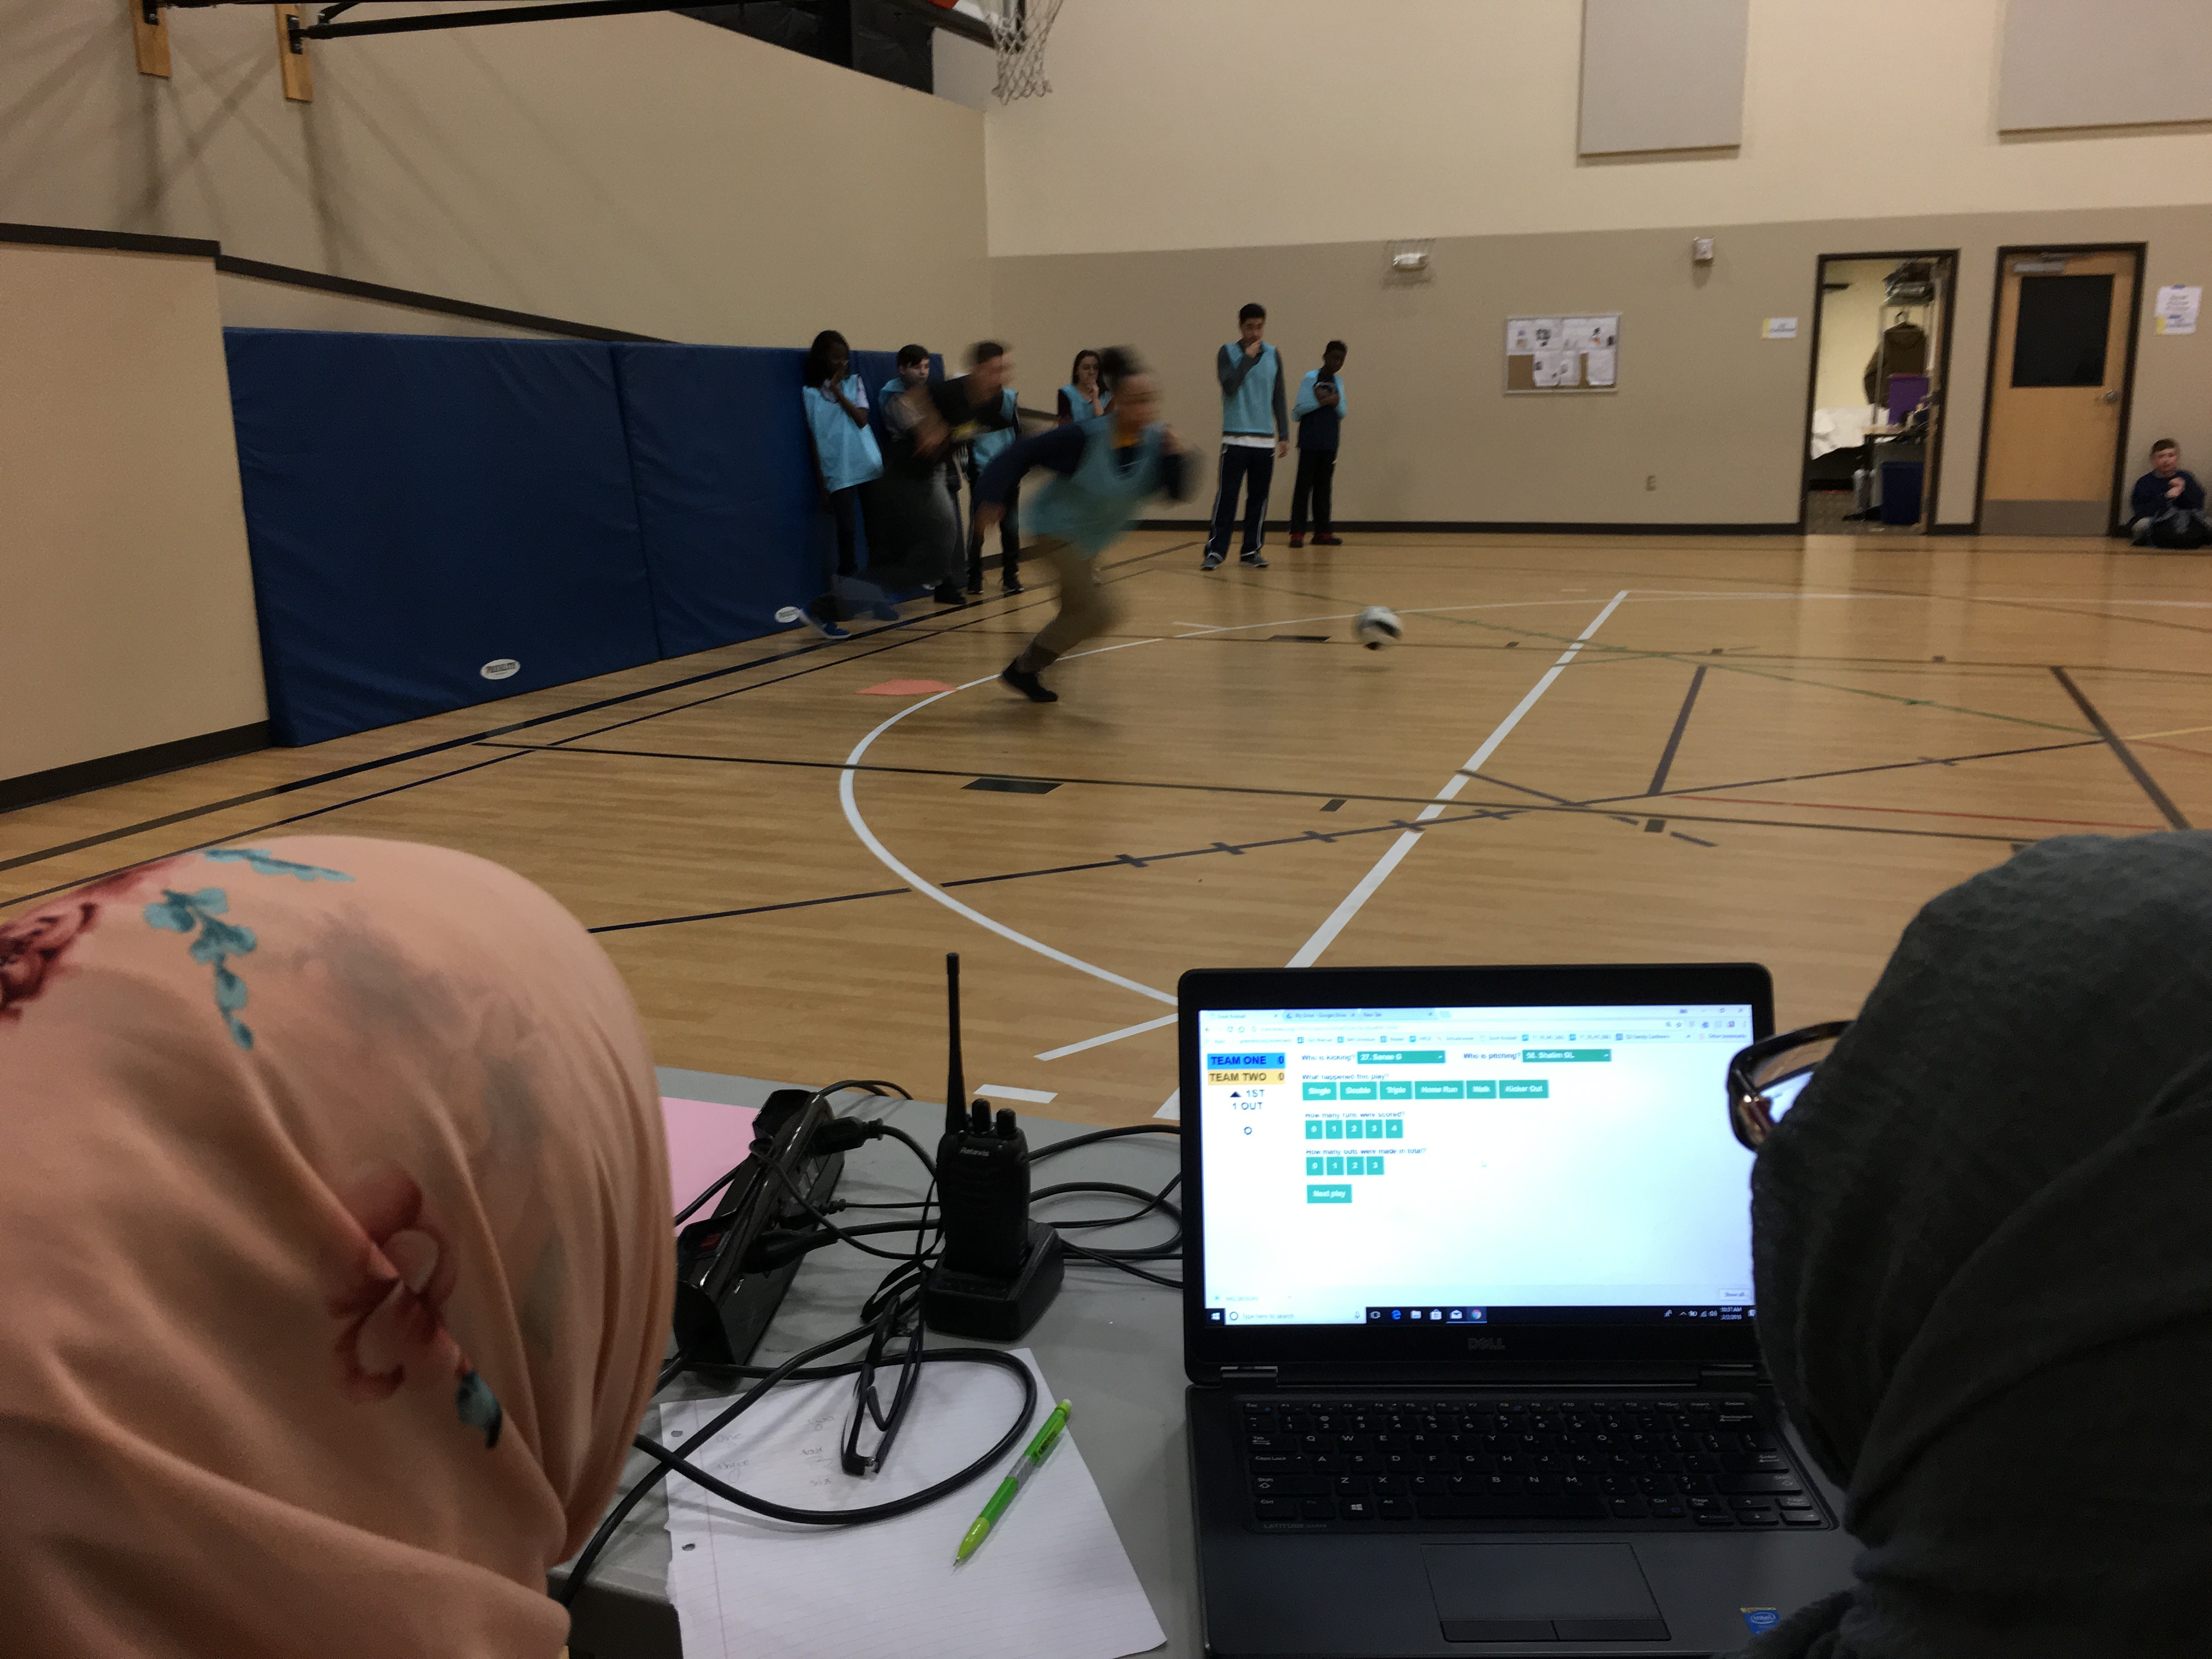
"Ideally, P.E. would be inclusive for both self-proclaimed athletes and non-athletes,” Eric Murphy, the teacher who led the implementation of this unit, told me. “In reality, however, P.E. ends up being one of the most segregated classrooms in the school, highlighting students that are naturally athletic without providing opportunities to students that haven't had a chance to learn and engage in physical activities. This kickball unit empowered the self-proclaimed non-athletes to break down the clique-y barriers of P.E. by adding competencies focused on strategy, leading to some serious athletic recognition." In fact, after the MoneyKickball unit at the start of our third quarter, Seth went on to earn a 99 percent as his grade for the semester.
The learning outcomes from this unit extend beyond the gymnasium. The data analytics and broader computational thinking skills students developed were applied in their other classes as well. Students analyze trends in data while learning about earthquakes in science class, interpreting statistics in math class or measuring population growth in social studies. Pattern recognition shows up in art class when students study specific artists, in music when they find similarities among songs in a genre and in ELA when breaking down the meter of a classic poem. Leveraging these skills across the curriculum empowers students to form cross-disciplinary connections and enhances their learning in each and every classroom.
So back to that bottom of the ninth. The stakes are high, the clock is ticking and your players are looking to you for the game-winning decision. You pour through the wealth of data at your fingertips: OBPs, SLGs, RAs, handedness and most frequent kicking direction… and even with the pressure building, you’re perfectly calm. Like Billy Beane of the 2002 Oakland Athletics, you know the data won’t let you or your team down.
This story is part of an EdSurge Research series about how school communities across the country are changing their practices to meet the needs of all learners. These stories are made publicly available with support from the Chan Zuckerberg Initiative, which had no influence over the content in this story. (Read our ethics statement here.) This work is licensed under a CC BY-NC-ND 4.0.
Eli Sheldon is the Computational Thinking Specialist at Green Dot Public Schools Washington.
Student names were changed for this story.
Popular on Edsurge
Opinion


