
High school dropout rates in the US may have reached a historic low of 7 percent in 2013. But that still leaves over 2 million students who go astray every year.
Attendance patterns can raise warning flags; after all, it’s not surprising that ditching class can be a precursor to dropping out completely. But even something as straightforward as pulling and organizing attendance record can be a “laborious” process, says Alex Insaurralde, Chief Academic Officer at Mare Island Technology (MIT) Academy in Vallejo, CA.
“The SIS we use right now is not very good at pulling data about students,” he tells EdSurge, “and it’s fairly difficult to use.” Different tools store records in different formats, and the manual process of stitching them together to correlate with student records is difficult, even for the former science teacher and instructionalist specialist.
Two years ago, Insaurralde turned to LearnSprout for insights about his school’s attendance patterns. At the time, the San Francisco, CA-based company offered an attendance analysis tool that lets administrators see, for instance, which day of the year kids are most likely to be absent.
But he and many other administrators across the 2,500 schools using the tool also wanted to understand how these patterns affected student outcomes. So last summer, LearnSprout piloted an Early Warning Solution (EWS) to help identify students at risk of not graduating from high school.
With EWS, LearnSprout correlates attendance behavior with another data point that schools already capture—grades—to predict those who are “on track” (typically, students with GPA above 2.5 and over 90% attendance rate), “at-risk” (below 2.0 GPA and under 80% attendance) and “borderline,” those who fall somewhere in between.
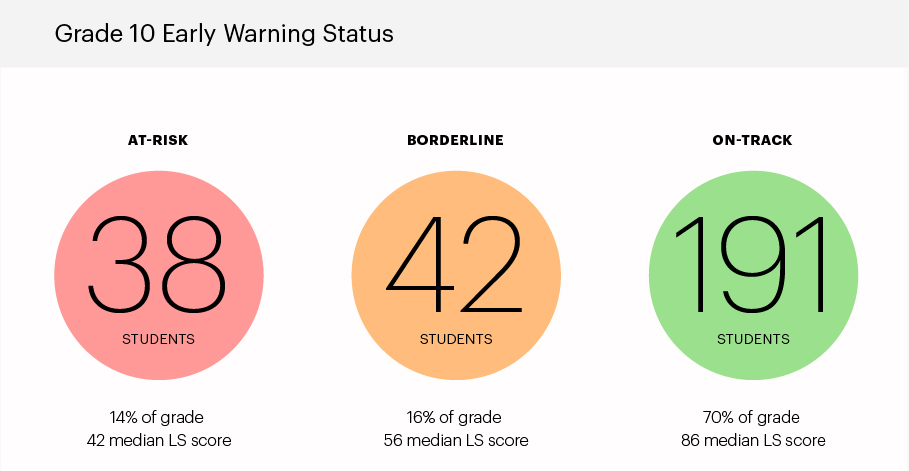
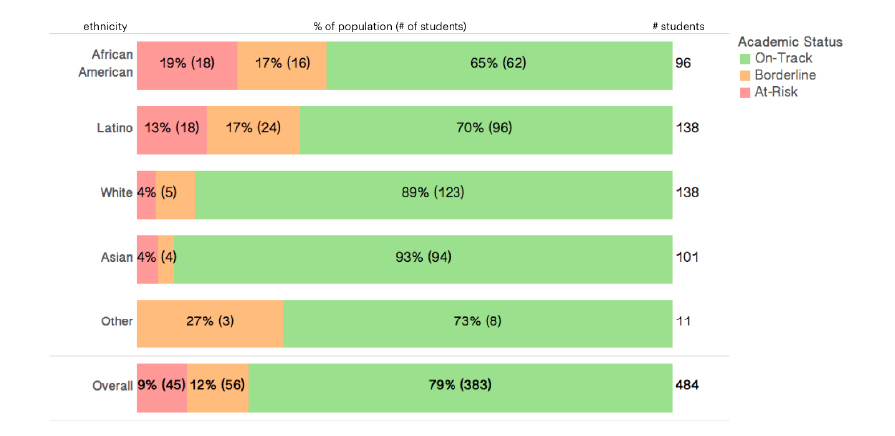
This top-level analysis is displayed on a dashboard that shows how many students fall into each of those three categories. The dashboard can also segment these results by ethnicity and socioeconomic background.
“Very often it’s easy to see the best students and the lowest performing ones because they stand out the most. But borderline students can easily fall through the cracks,” says Insaurralde.
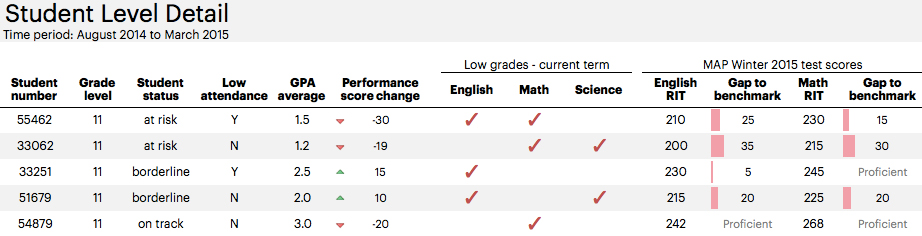
In addition to the dashboard, LearnSprout also provides a customized Excel spreadsheet that lets administrators filter and sort by different criteria, such as behavior, demographics and assessment results to pinpoint individual students who are struggling. “Some schools ask us to marry this data with ethnicity and demographic information,” says LearnSprout co-founder and CEO, Franklyn Chien, “to see if there are certain populations that are struggling more than others.”
Insaurralde wanted to include data about students’ demographic and socioeconomic background, along with their results on STAR Assessments, which are given three times a year to determine math and reading proficiency. So far, the reports support one of his hunches: “A majority of Latino students at grade 6 are borderline and potentially at-risk. I know this anecdotally, but this report, in conjunction with a spreadsheet, allows us to identify specific students” for intervention.
Administrators often have a good guess about who the struggling students are, says Anna Hon, LearnSprout’s director of growth and operations. “We show them data to support or refute their hypotheses about whether struggling students belong in which sub-group.”
The data can raise as many new questions as it answers. For Insaurralde, one of the more startling insights was seeing how grades fluctuated wildly between classes in the same subject but taught by different teachers. “There could be a wide variation of grading practices between teachers who teach the same course,” surmises Insaurralde. He suspects that first-year teachers who struggle with classroom management tend to give more failing grades.
“I don’t want to rely so much on intuition, but let the data speak for itself,” he says. With these reports, which are provided every six weeks, Insaurralde says he’s already “set up a series of meetings by department and I’ll be presenting this data to them.”
New education technology tools promise more data that, presumably, offer more insights. But many educators already struggle to make sense of the existing data that their schools capture. Chien intends for EWS to be “part of your data team” and hopes the system can help educators provide more targeted—and timely—responses to intervention.
Early warning systems are not new; research on other tools used in schools today suggest these tools can supplement intervention efforts from educators. “The earlier you identify at-risk students,” says Hon, “the better chance you have to nudge them back on track.

