
When No Child Left Behind passed back in 2002, Congress enthusiastically proclaimed that 100 percent of American students would be proficient in reading and math by 2014. What they didn’t expect was that some states would significantly lower the bar for proficiency to avoid being marked as failing or losing special funding from the federal government.
Today, much of the shucking and jiving around setting standards and defining proficiency at the state level has not changed, meaning fourth-grade students in Louisiana can be held to a much lower reading and math proficiency standard than students in New York. However, the National Center for Education Statistics (NCES), an organization that has been mapping proficiency standards for 15 years, says the gap between how states define proficiency is narrowing.
NCES has been administering the National Assessment of Educational Progress (NAEP) exam since 1969. On the NAEP exams, achievement levels are set at three tiered levels: “Basic,” “Proficient” and “Advanced” based on a number scale between 0 and 500— with the designation “Below Basic” given to anything that falls below a 262, or the Basic level. These definitions of achievement levels for 4th and 8th-grade reading and math have remained consistent since the early 90s, according to NAEP officials.
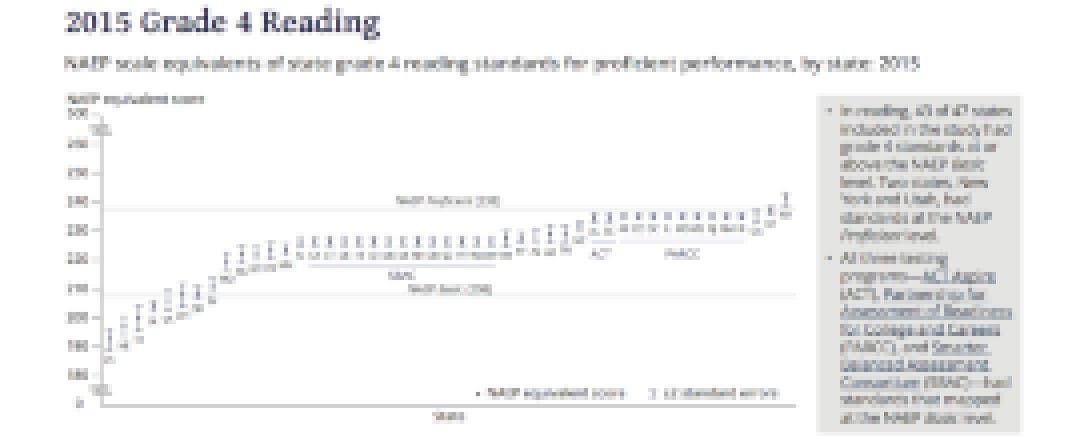
To set the stage for a debate on rigorous standards, researchers from NAEP recently looked at 47 states that participated in three nationally-administered exams: the ACT Aspire (ACT), the Partnership for Assessment of Readiness for College and Careers (PARCC) and the Smarter Balanced Assessment Consortium (SBAC). They then estimated NAEP equivalent scores for the exams and mapped the outcomes onto a graph depicting how their proficiency levels measured in comparison.
“If you think about what a proficient student can do as indicated by our achievement level descriptions and our item map, and what a below-basic [student] can do in terms of things they can’t answer, things they cannot respond to,” then “I would imagine that those students would struggle when they move to states with higher standards,” explains NCES Associate Commissioner Peggy Carr.
Carr notes that in states such as Louisiana, where proficiency levels are set below Basic in 4th-grade reading and 8th-grade math, students may struggle if they move to states like New York, where 4th-grade reading proficiency levels are set above NAEP rigor. However, she adds a caveat, saying the struggle is less about student performance (since they have seen no correlation between standards and student achievement) and more about students adjusting to settings where expectations are higher, and teachers push them to do more.
Bringing Up Alignment
Yet in spite of the existing gaps, Carr notes that current proficiency standards are more aligned nationally today then they have been in the past. She also sees a massive uptick in the number of states raising overall standards between 2013 and 2015, crediting state affiliation with groups like PARCC and Smarter Balanced, both organizations that acknowledge being influenced by Common Core State Standards.
This is a surprising achievement given how states have historically bucked national standards alignment propositions. In 1994, President Bill Clinton’s attempt to establish the National Education Standards and Improvement Council, a federal body that would approve state standards, was effectively killed by Congress.
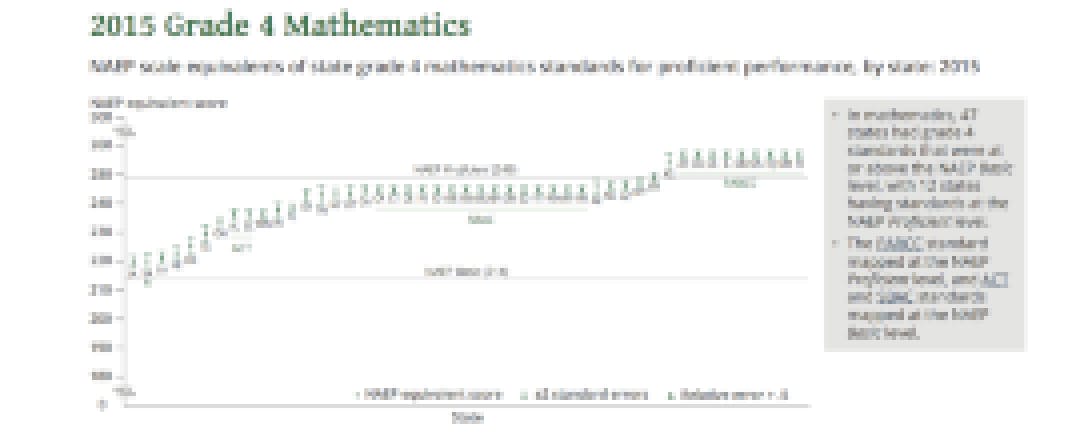
But today Carr sees things changing. Speaking of 4th-grade math proficiency, she says, “there are no states with standards that are mapping at the below-Basic range,” although some are mapping below that level in other areas, like the aforementioned cases in Louisiana.


But not all education experts will be pleased by the upwards shift in state proficiency levels. Setting “aspirational” standards that students fail to meet year after year has been described by some critics, such as “A Nation at Risk” co-author James Harvey, as putting up benchmarks that “lack validity and don’t make sense.”
Yet Carr is hopeful about the trend toward higher standards, noting that more rigorous classroom work might come out of it.
“I think the whole narrative that we are having at this large-scale assessment space is basically asking states to rethink” their approaches, explains Carr. “Are your definitions of what is proficient reasonable? Is it consistent with what everyone else is thinking? Is it good enough?”

