Reporting on edtech VC funding is one of our hobbies here at EdSurge. Every month we report on the total VC funding coming into the US edtech industry. This monthly total is an important indicator of the strength of the industry.
But can we use the total to show the "typical" size of an edtech deal that month? Not really. Take a peek at how much the biggest deals of the month swamped those monthly numbers:
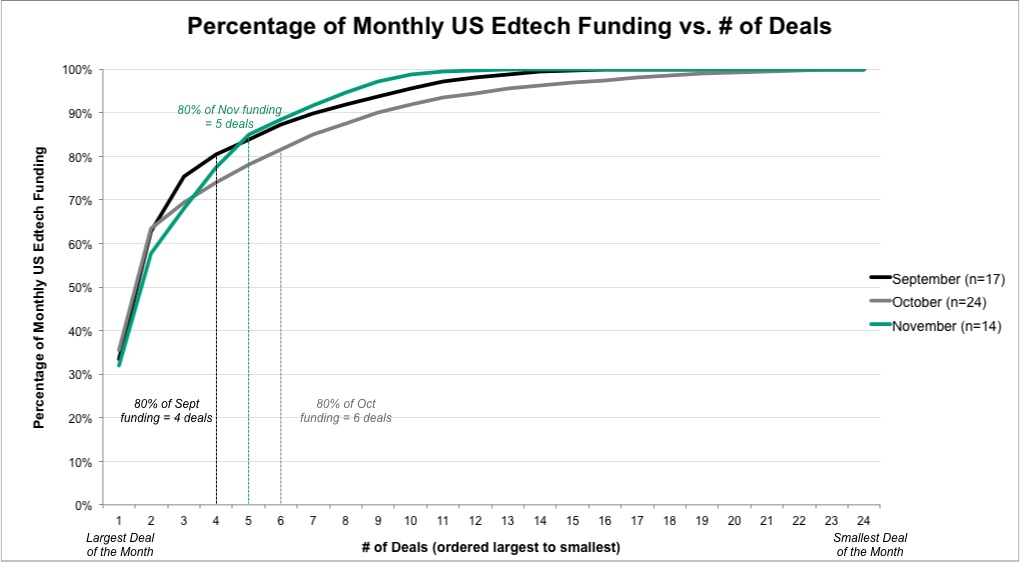
The graph below shows the percentage of total monthly funding (y-axis) by the largest x deals of the month (x-axis) for September, October and November of 2014.
The rapid growth and long tail of each month's data is a big reminder that in this industry, the vast majority of each month's funding comes from just a few deals: It took just 4, 6, and 5 deals to top 80% of the month's deals in September, November, and October respectively.


