It’s hard to surf the web this week without coming across news headlines shrieking about the most recent PISA scores: Among them: "PISA Results show 'educational stagnation' in the US" and "Sweden tumbles in global schools ranking"!
But before getting drawn in, let’s take a step back and look at the reports.
The big conclusions are clear: Asian countries (starting with China) continue to sit at the top of the rankings. Finland and Sweden, formerly dominating countries, have fallen. In between, the United States sits uncomfortably in what U.S. Secretary of Education Arne Duncan calls a “picture of educational stagnation.”
But there's more to PISA than initially meets the eye: it also offers a peek into standardized testing worldwide, how results can be misinterpreted, and what lessons can actually be taken away from looking at the whole report--not just the first few tables of a 52-page document.
PISA 101
To start off, let’s look at the opening data.
The PISA exams sampled approximately 510,000 students from 65 countries, with 12,000 of those students hailing from the United States. In the U.S., Connecticut, Florida, and Massachusetts also elected to have students take the test as individual entities, participating as international benchmarking systems and receiving individually separate scores.
Compared to the 2009 PISA results, the U.S. scores either stagnated or fell in ranking, putting American students in the middle of the 65 participating countries. While the U.S. ranked a relatively familiar 24th in reading (down one ranking from 2009), it fell to 36th in math (down six spots from 2009) and 28th in science (down nine spots from 2009).
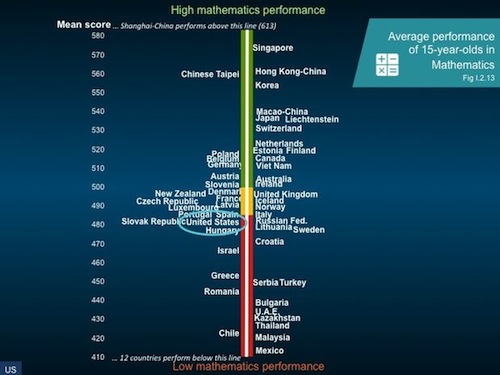
Math slide from OECD PISA Deputy Director Andreas Schleicher’s report
When compared to the 33 other industrialized countries (namely members of the Organisation for Economic Co-operation and Development or OECD), the middle ranking was evident again--17th in reading (down from 14th), 23rd in science (down from 17th), and 20th in math (up from 25th in the 2009 tests).
Winning top marks were Shanghai-China, Singapore, and Hong Kong-China. Shanghai, in particular, topped the list and produced the highest percentage of student scoring level 5 and above in mathematics (55%), science (27%), and reading (25%). Level 5 and 6 performers are credited as PISA’s “top performers,” according to OECD’s PISA Deputy Director Andreas Schleicher. The US’s percentage of top performers: 9% for math, 7% for science, and 8% for reading.
Do such scores mean that China’s current 15-year-olds will someday lead the country to be the world’s undeniable superpower? Not so fast, Sherlock.
Be careful about blanket assumptions
Consider first the underlying skews in the data based on the populations tested.
China is the prime example. Earlier this year, Brookings Institute scholar Tom Loveless observed that China reports individual city scores--not the scores of the nation as a whole. In fact, China has an “unusual agreement” with the OECD (which administers the test) that gives its government the right to review test scores and decide which provinces can release their scores. Slate Magazine's Joshua Keating reported on this reality again today, headlining his article with a flared call-to-action: "We Need to Stop Letting China Cheat on International Education Rankings."
And the high scorer, Shanghai? Not representative of China as a whole, according to Loveless. “Shanghai is a province-level municipality that has historically attracted the nation’s elites,” he writes. “About 84 percent of Shanghai high school graduates go to college, compared to 24 percent nationally."
It's also important to distinguish between "scores" and "rankings." One may confuse a lower ranking with a poorer score, but sometimes that isn't the case. Score and ranking don't always correlate.
Take Denmark and the U.S., for example. Danish students in 2009 and 2012 scored almost identically in math. But while Denmark ranked 19th in 2009, the country dropped to the 22nd position in the more recent report. The U.S. itself, for the most part, stayed around the same place by way of actual average score. The PISA “Trends in US Performance” report notes that despite the U.S.' drop in rankings, the average score in 2012 for reading, science, and math “is not measurably different than in comparison year.”
Look at information beyond the rankings
While the PISA's ranking data is usually the first area of note, what about those other pieces of information that we can gain helpful insight from? For example, take U.S. students’ feelings of self-efficacy. While Schleicher points out that American students consistently rate highly in self-confidence (with at least 50% of students reporting confidence when approaching any 2012 PISA math problem), the U.S. averaged only 5.5% of students as demonstrating "resilience"--far below the average percentage of “resilient students” in other countries (shown below). Translation: our students may be confident when they first approach a question, but if the problem proves difficult or multi-dimensional, all bets are off (for most of them, at least).

"Resilience" slide from OECD PISA Deputy Director Andreas Schleicher’s report
Lessons learned?
We can talk about the results all day, but the reality of the situation is this: Although the U.S. ranks fifth in spending per student (approximately $115,000 per student), the country has not made significant (if any) growth on the PISA scores. So, what can we learn from other countries?
Perhaps we should look at those countries that both gained ranking and significant score increases. Shortly after the results were released, the OECD called out Polish students for making steady progress. Polish students ranked in the top 25% of PISA performers across the board (math, science, and reading) after making huge jumps in math and science over the past three cycles of PISA examinations. Between 2000 and 2009, Poland students increased their reading scores by 21 points, on average.
According to Miroslaw Handke, Poland’s former Minister of National Education, Poland sought to “make education more attractive by making it more adaptable to meet the unique talents of every child” way back in 1999. In order to achieve this, the country carried out aggressive measures like extending lower-education schools by one year, enhancing school autonomy and introducing standardized national tests.
Poland's emphasis on policy reform and nationwide practice could certainly set the example for the United States. After all, the U.S. is no stranger to education reforms. Look at charter schools and alternative certification programs.
But perhaps, at the end of the day, the real conclusion that we can draw from the 2012 PISA results is that the means for interpretation of these reports is up to us. Sure, we could focus on the rankings. But if we choose to move beyond the rankings alone and look at the whole picture--efficacy reporting, graduation rates, countries' score improvements--we may get a better idea on how to balance that desire for higher scores with a holistic approach to improving the American public education system.

